Syllabus Connection
Prev
Next

Defining Urbanization and Urban Settlement
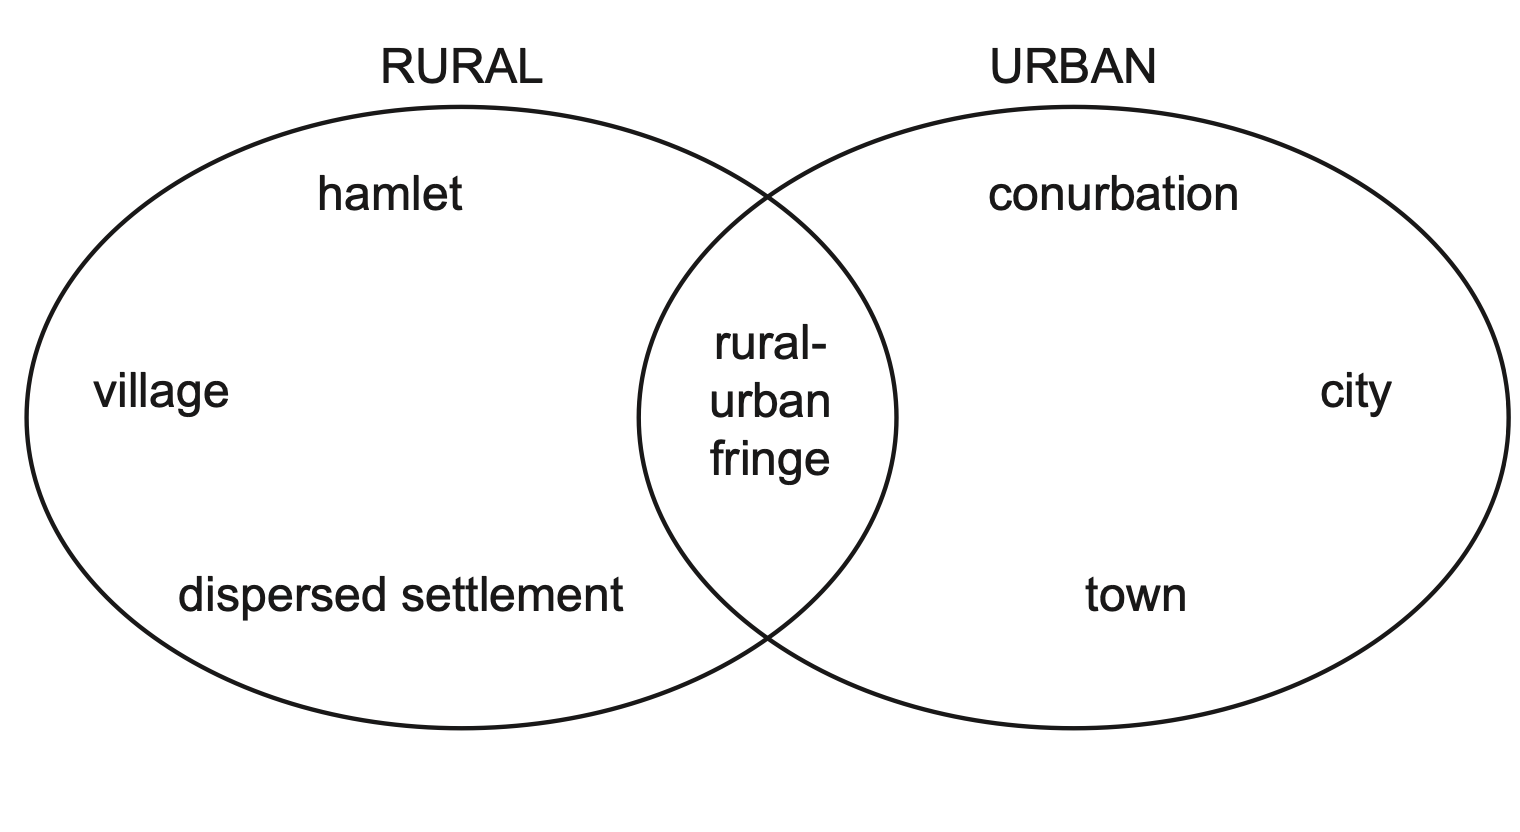
In general, urban refers to town and cities and rural refers to countryside.
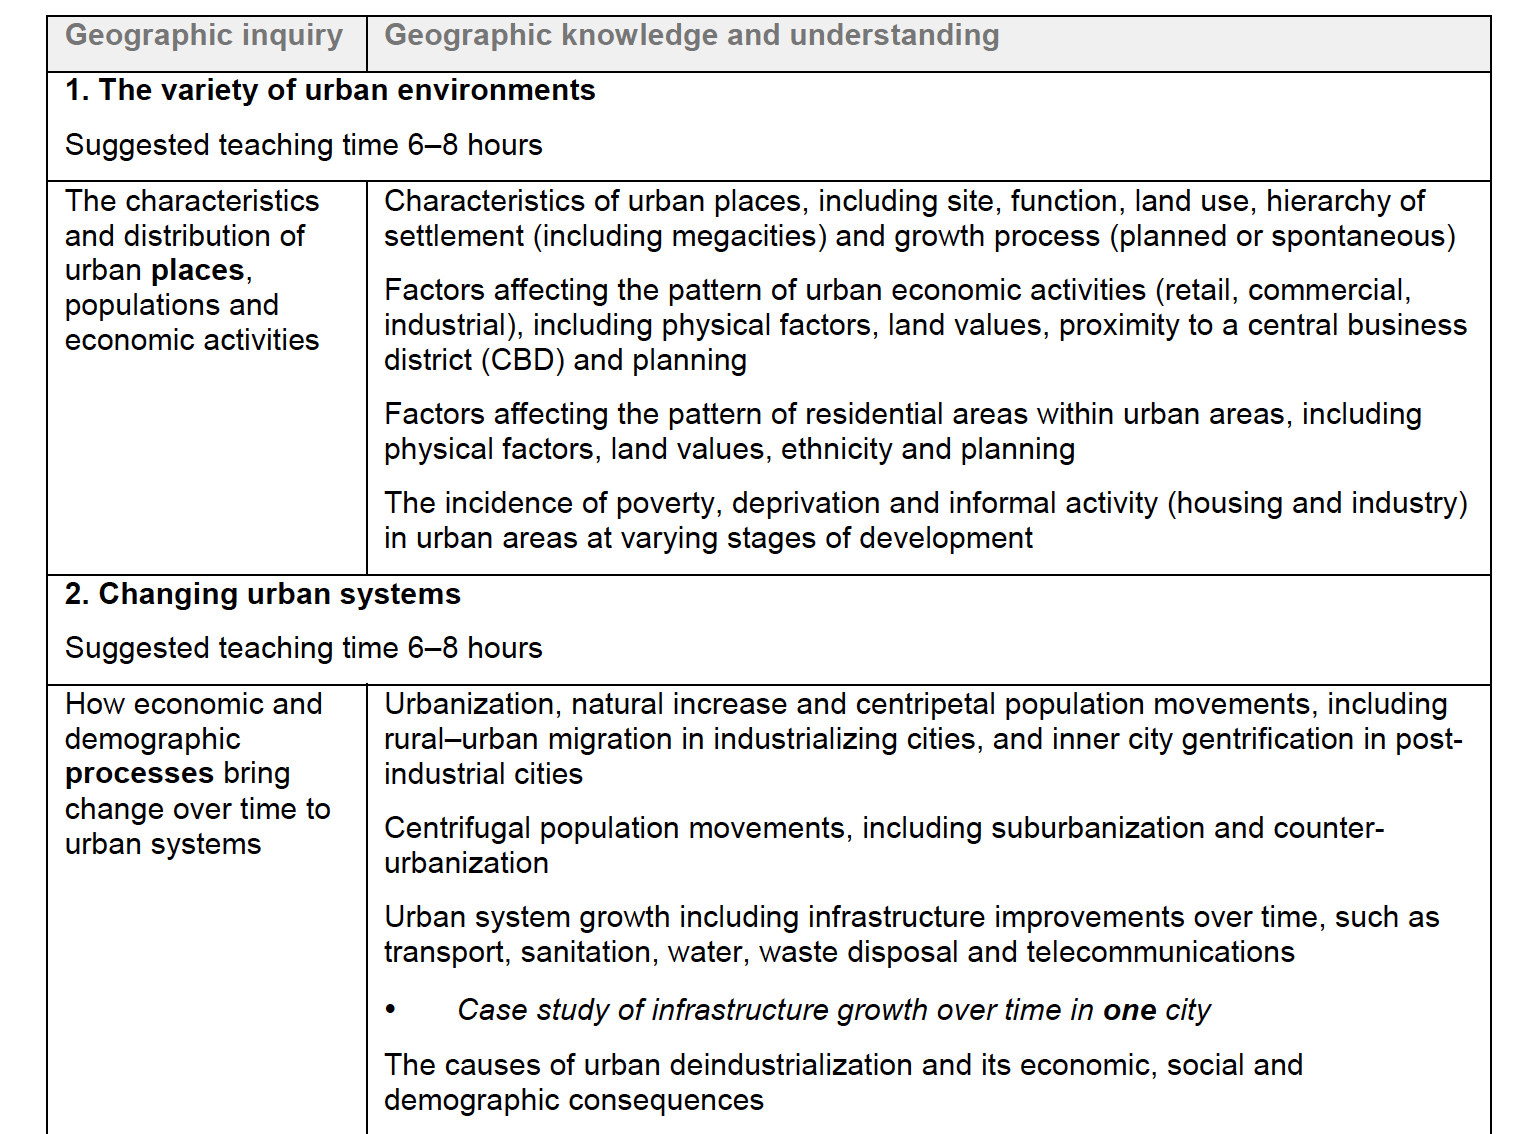
Demographic interpretation: urbanization is the process signifying an increase in the proportion of a population living in the towns and cities, designated as urban areas, within a country or region.
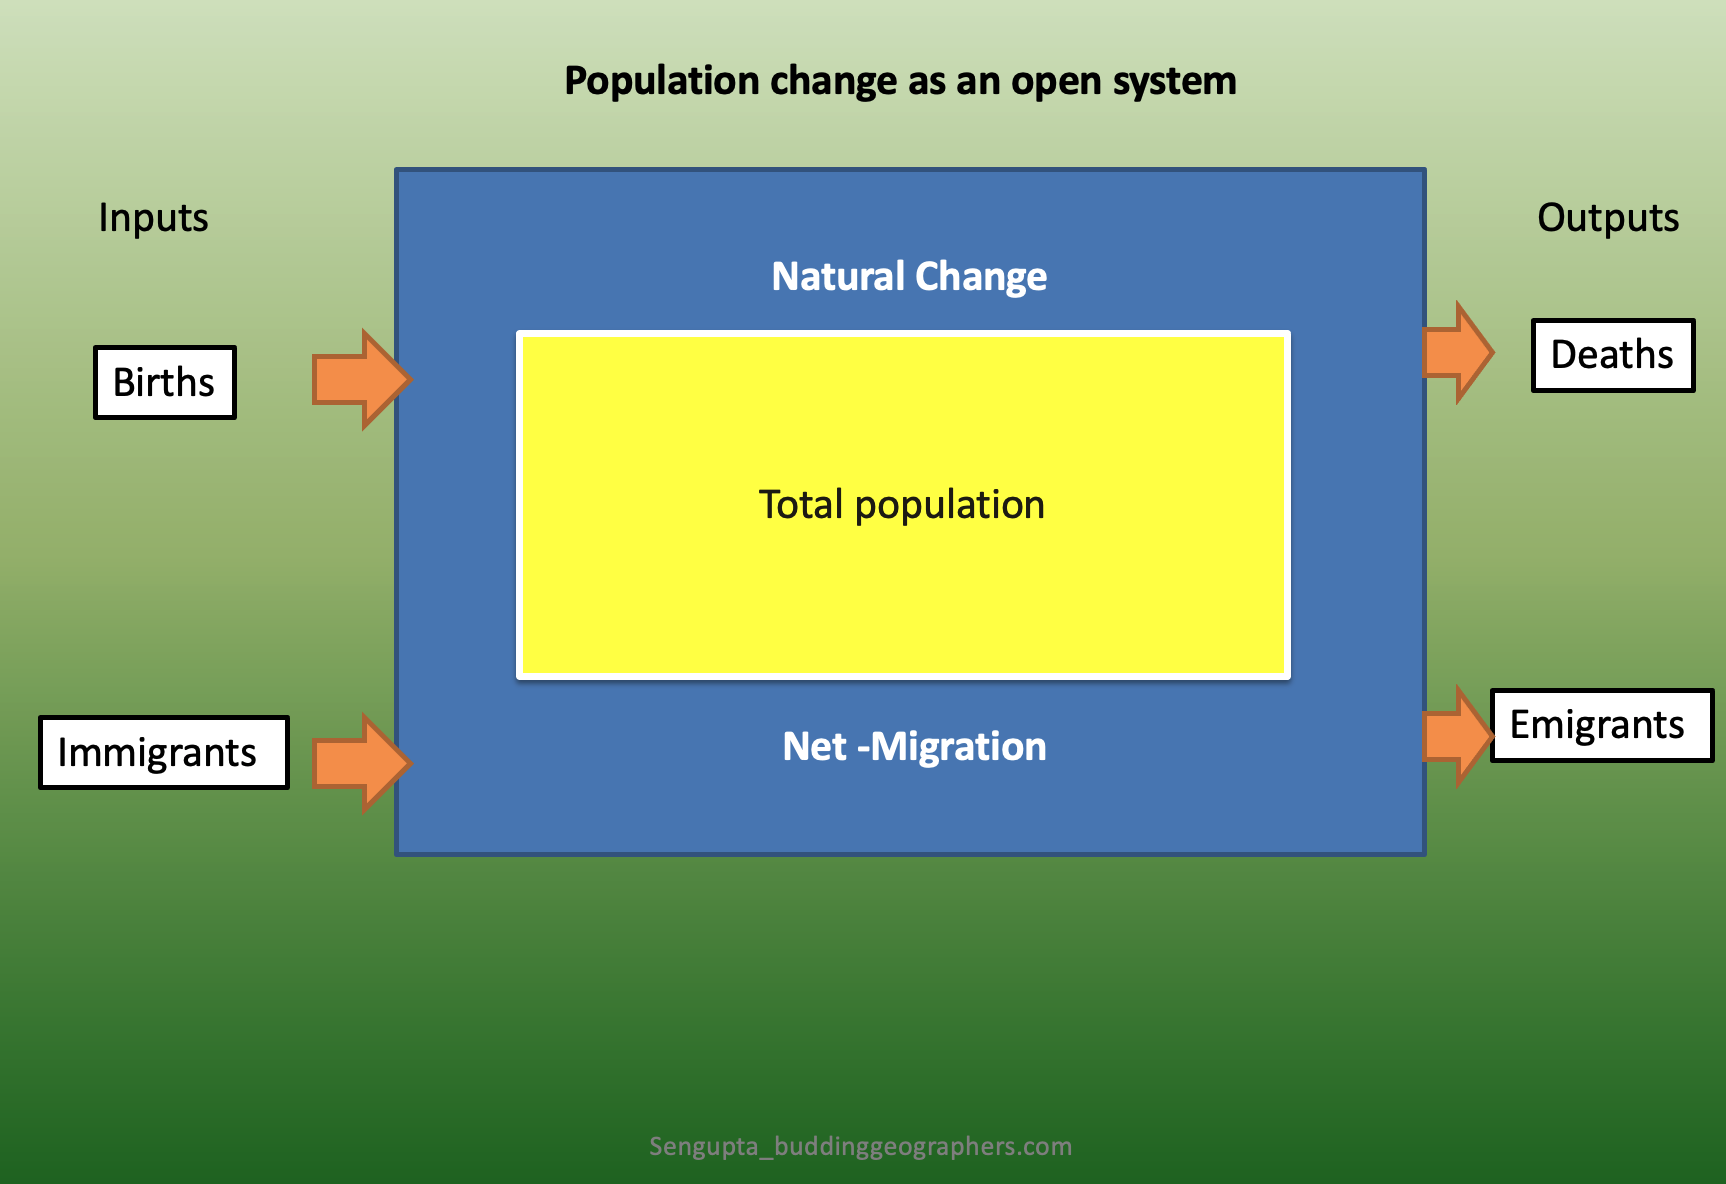
Natural increase (when birthrate is higher than death rate) and net migration (immigration-emigration) are the demographic causes of the growth of urbanization.
Socio-economic interpretation of urbanization: – urbanization often accompanies industrialization, large-scale manufacturing and dominance of tertiary sector jobs. Cities perform important commercial functions, and serve as locations for new forms of production, distribution and exchange. The social structure is also very different from those of rural societies.
Behavioral approach to urbanization: urbanization is marked by a typical set of human behavior and attitudes towards society. Urbanization can typically be associated with the concept of Gesellschaft (Ferdinand Tönnies theories of urban life), where the social relationship is founded on rationality, efficiency and contractual obligations and individual behavior is exerted through impersonal, institutionalized codes generating typical urban culture.
| Basic Concepts | Explanations |
|---|---|
| What is a rural and urban settlement? | Settlement is a place where people live and interact through several activities such as agriculture, trading or services. Settlement helps us to understand man’s relationship with his environment. In general rural refers to countryside and urban refers to town and cities. Communities living in rural settlement are predominantly involved in primary activities such as farming, lumbering and mining. On the other hand, unban communities are engaged predominantly in secondary and tertiary activities such as construction, food processing, banking research etc. Rural and urban settlements are often compared also in terms of their functions, population sizes and population density. A rural settlement tends to have small population and low population density. Urban settlement often has a large population size and high population density. |
| Site of a city | Site is the actual piece of land upon which a settlement is built. Wet point sites settlements have a good water supply. on the contrary Dry point sites are away from the risk of flooding. Coastal cities are considered as good trading sites whereas mining town such as Bisbee in Arizona was founded as a copper, gold, and silver mining town, would be considered as a 'resource site' based settlement. |
| Functions and land use of a city | Functions and land use of a city may change over time. Most of the urban places have major industrial, manufacturing and tertiary sector oriented functions. Some are important research and development centers. On the other hand, capital cities have dominant administrative functions and related jobs. |
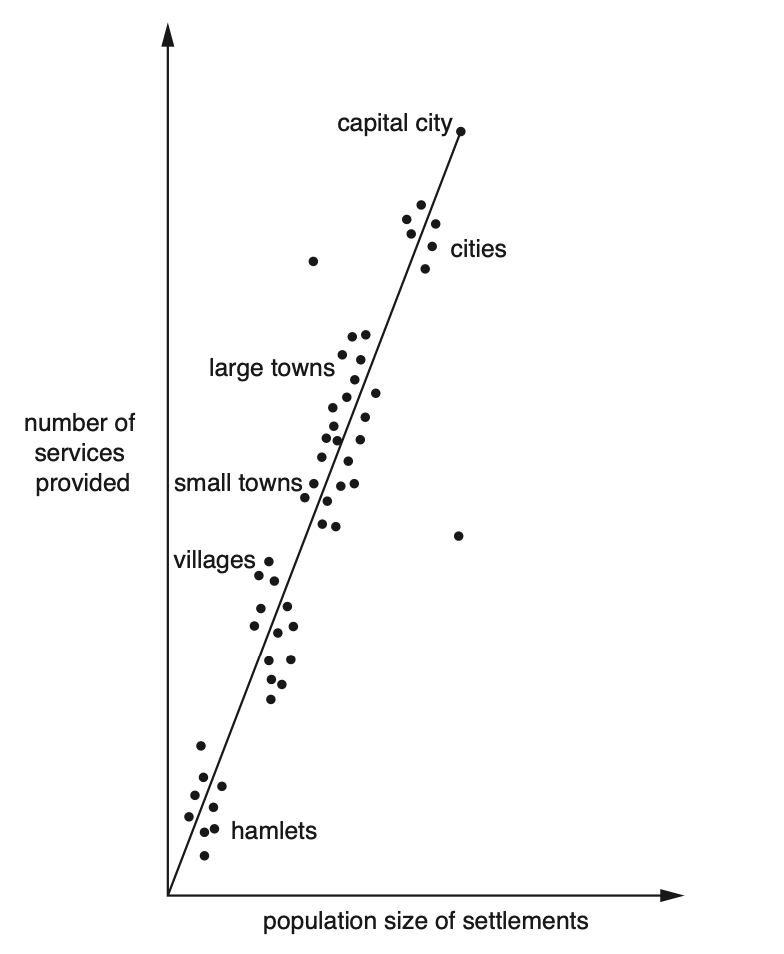
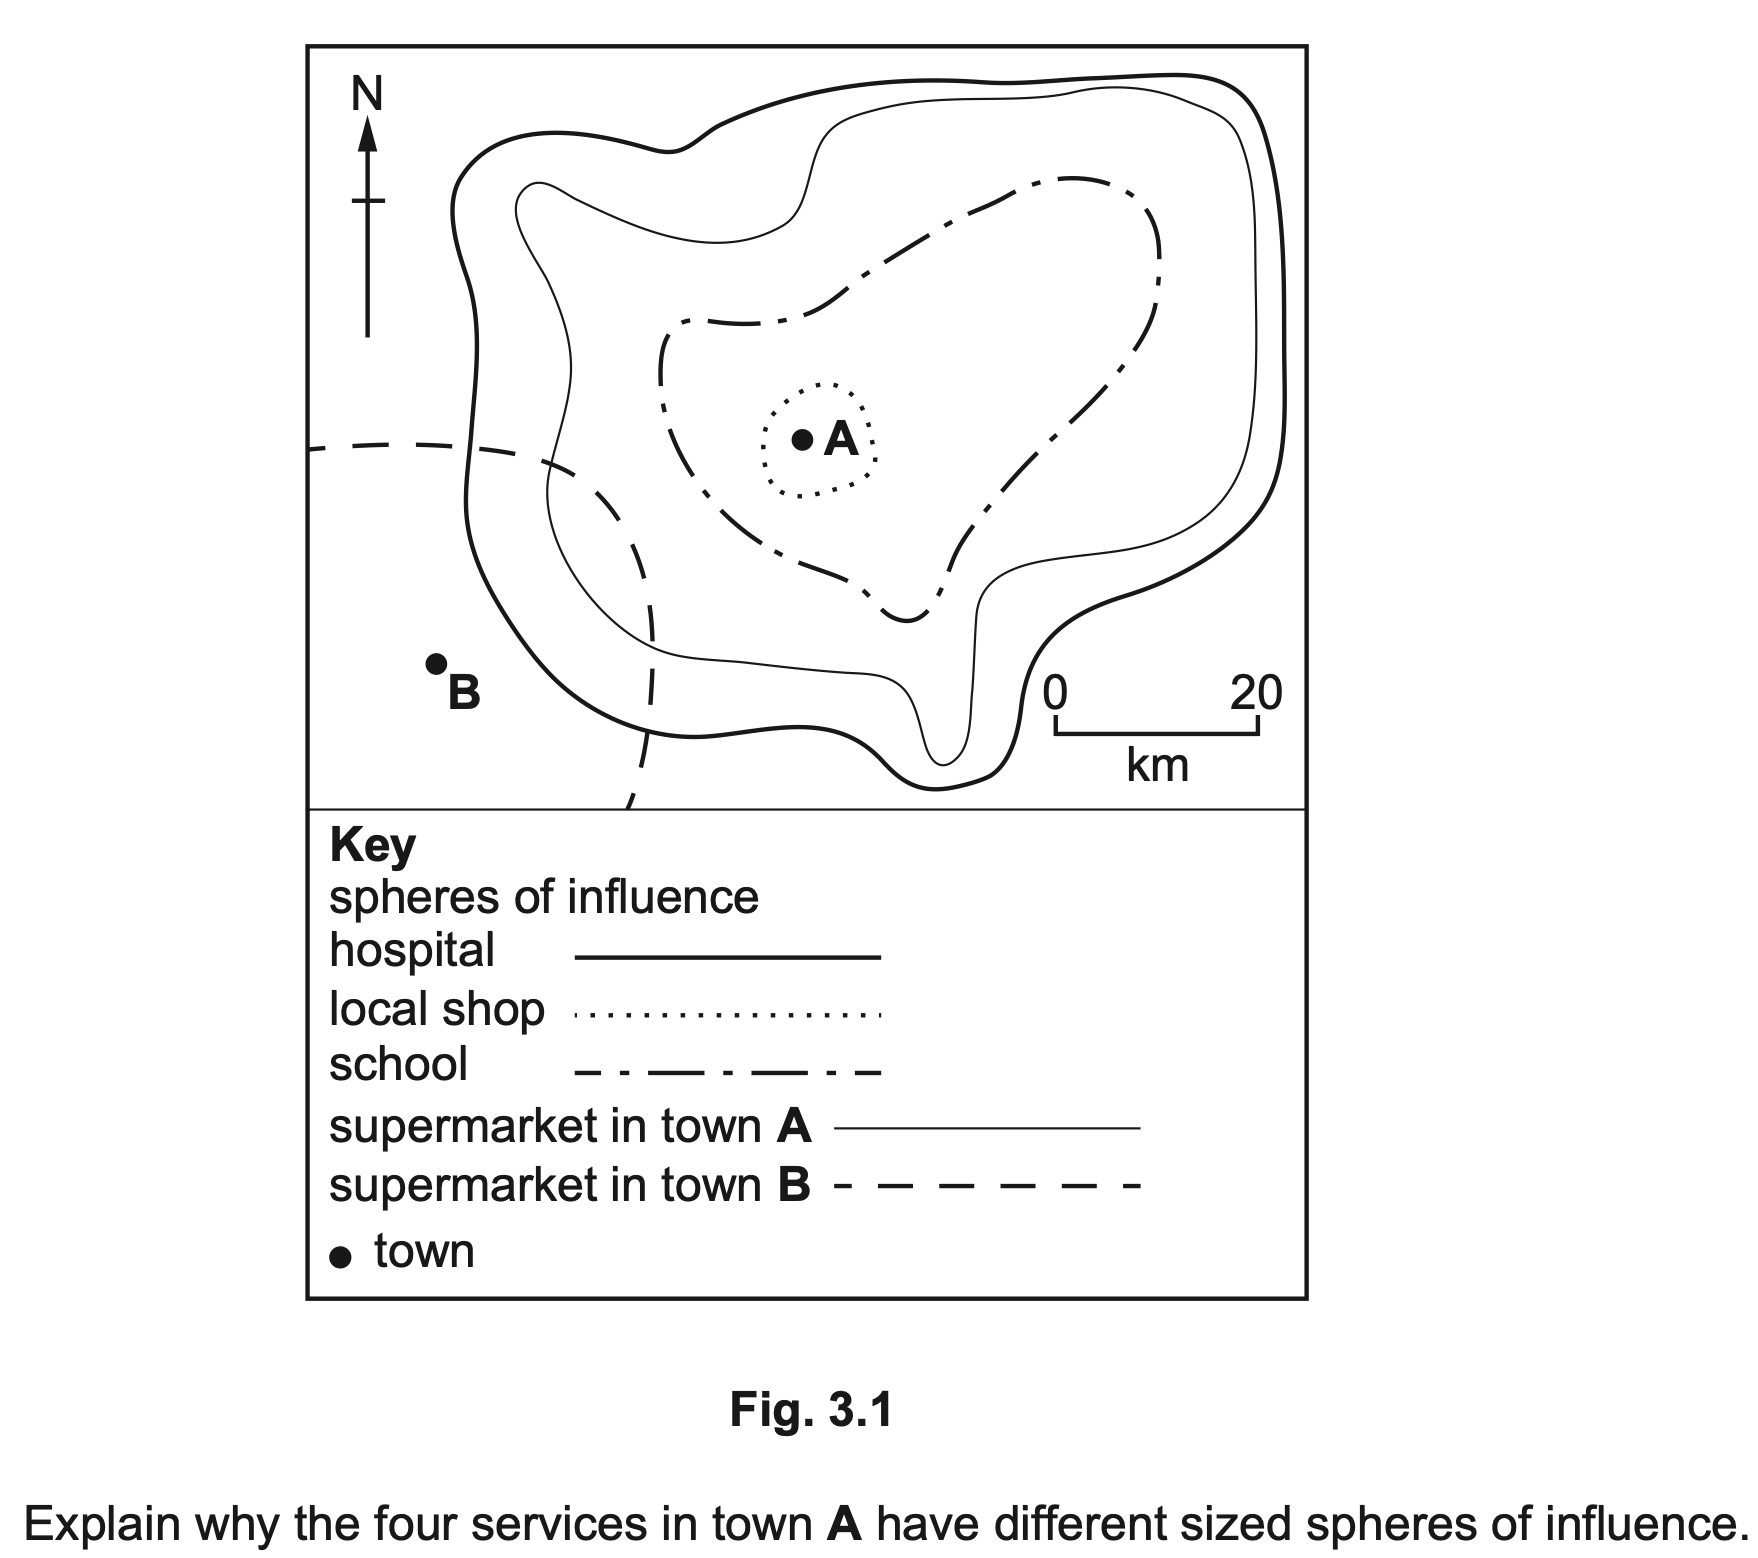
| Hierarchy of settlements | An ordering of settlements according to the size of population, number of services and sphere of influence. |
Prev
Next
Prev
Next
Your Tasks
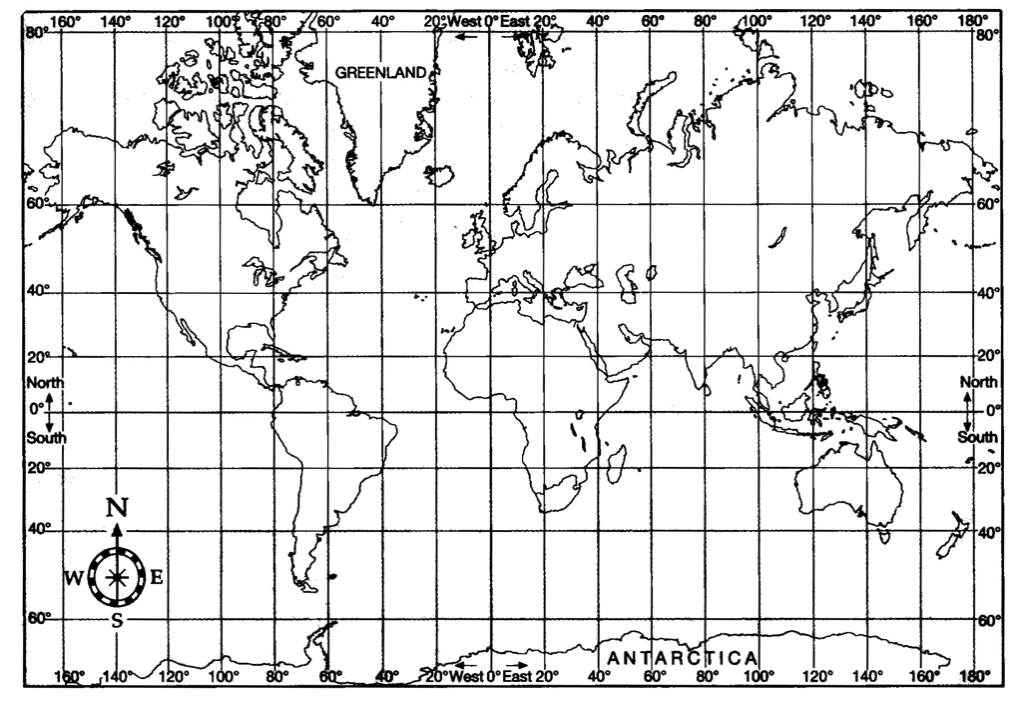
Task 1. Note and mark the name of the Megacities mentioned in the video (above) and locate them on the given map
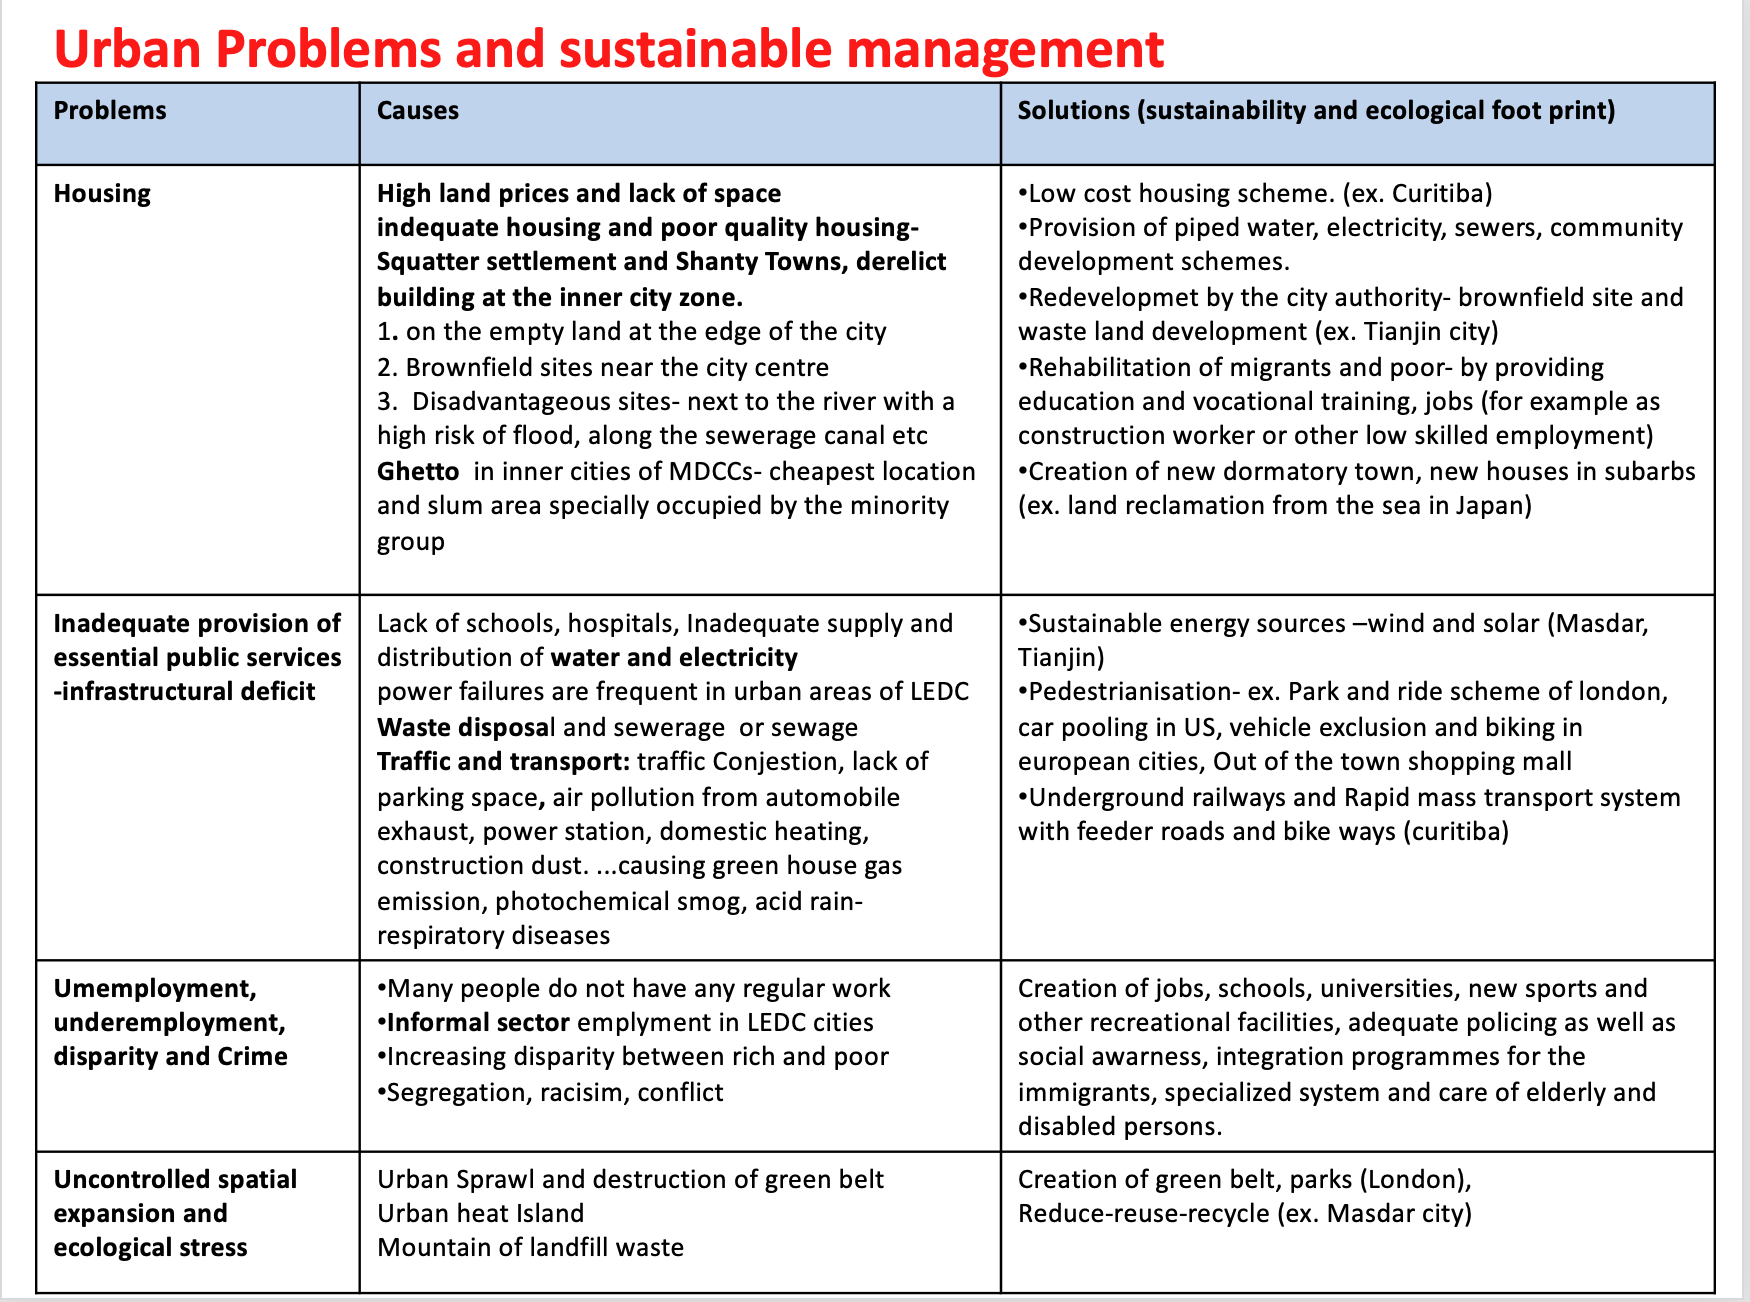
Task 2. Identify the urban challenges/problems of these cities
Demography Speaks: The rise of “Mega-Cities” with population over 10 million
- One of the features of today’s urbanization is the continuing growth of large cities, including mega-cities.
- The number of mega-cities rose from just two (Greater London and New York metropolitan area) in 1950 to 23 in 1995, with 17 of them in the developing world.
- As of 2022, there are nearly 35 mega-cities. The largest of these, are the metropolitan areas of Tokyo and New Delhi, each of these having a population of over 30 million inhabitants. Tokyo is the largest metropolitan area, while Shanghai is the largest city. Out of 35, 23 of these mega-cities are located in Asia.
- With the increase in life expectancy, and decrease in birth rate, increase in divorce rate in post-industrial society, the city has once more become man’s natural habitat.
Global City (Saskia Sassan, 1991)
The term was first introduced by Saskia Sassan in her book The global city. Initially referring to New York, London, Tokyo. She described global cities as the one that play a major role in global affair in terms of politics, economy and culture.
Alpha city : Well-connected places are called global hubs in network theory. London, New York city, Singapore, Shanghai, Hong Kong, Dubai, Tokyo, Mumbai, Frankfurt all are considered as global hub. Global hub includes Alpha ++, Alpha + and Alpha cities. Alpha ++ cities are most integrated with the global economy. Alpha cities are mostly large megacities with large frequency and density of interconnectedness. Cities are ranked by the Globalization and World cities research Institute (GaWC) based on several economic, social and cultural factors. GaWC is the leading institute ranking world cities.Cities are ranked into Alpha, Beta and Gamma cities by taking into account the factors like business activity, human capital, information exchange, cultural exchange and political engagement. Click here to access GaWc ranking of the cities based on their connectedness.
Viewing modern cities as the ‘technoscape’: Components of a Smart City
- It involves solutions of the urban problems using modern technology.
- It is a city centric or city specific approach means each city has its own sets of problems, approaches and solution. There is no one size fits all way in designing a smart city.
- Preconditions to the success of a smart city system: A successful democracy and a well trained human resource to develop the system and to access and distribute the available public data.
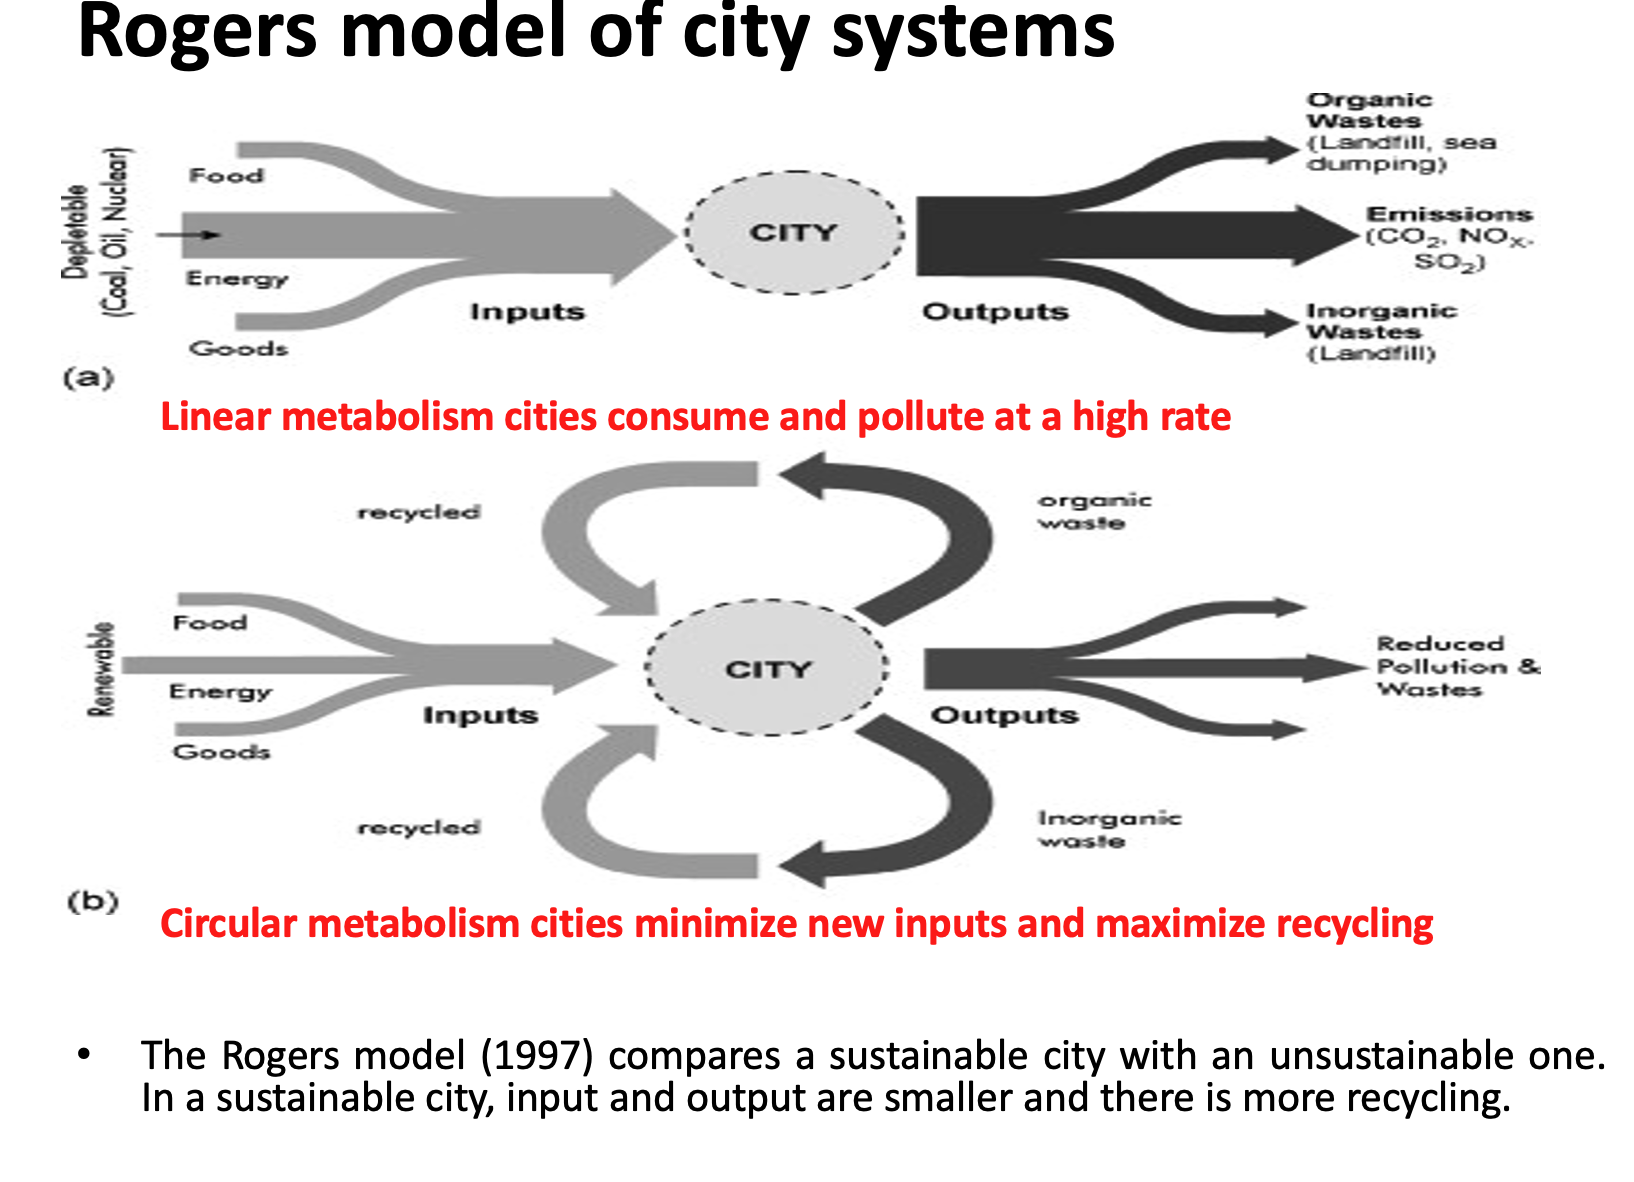
- It involves integration of the Input-Process and Output system and uses to the concept of circular metabolism to ensure sustainability. Smart city uses the concept of Reduce-Reuse-Recycle (3R principles) to make the city sustainable as a smart response. It seeks to reduce the total input into the system to save resources, processing is based on optimality and reuse principle, outputs and wastes are recycled. Therefore a smart city is much more than a high-tech city, it is a city that takes advantage of the creativity and potential of new technologies to meet the challenges of urban life.
I

Prev
Next
Resilient City design
Definition: Resilient cities have ability to absorb, recover, and prepare for future shocks, especially challenges associated with climate change.
Resilient cities are economically productive, socially inclusive and environmentally friendly cities marked by efficient energy, water and waste infrastructure to reduce vulnerability to environmental hazards such as air and water pollution, contamination of land, challenges of global warming and so on. These cities are sustainable and based on the concept of circular metabolism where waste recycling is of prime importance.

Prev
Next
Variation in Pattern and global growth rate of urbanization
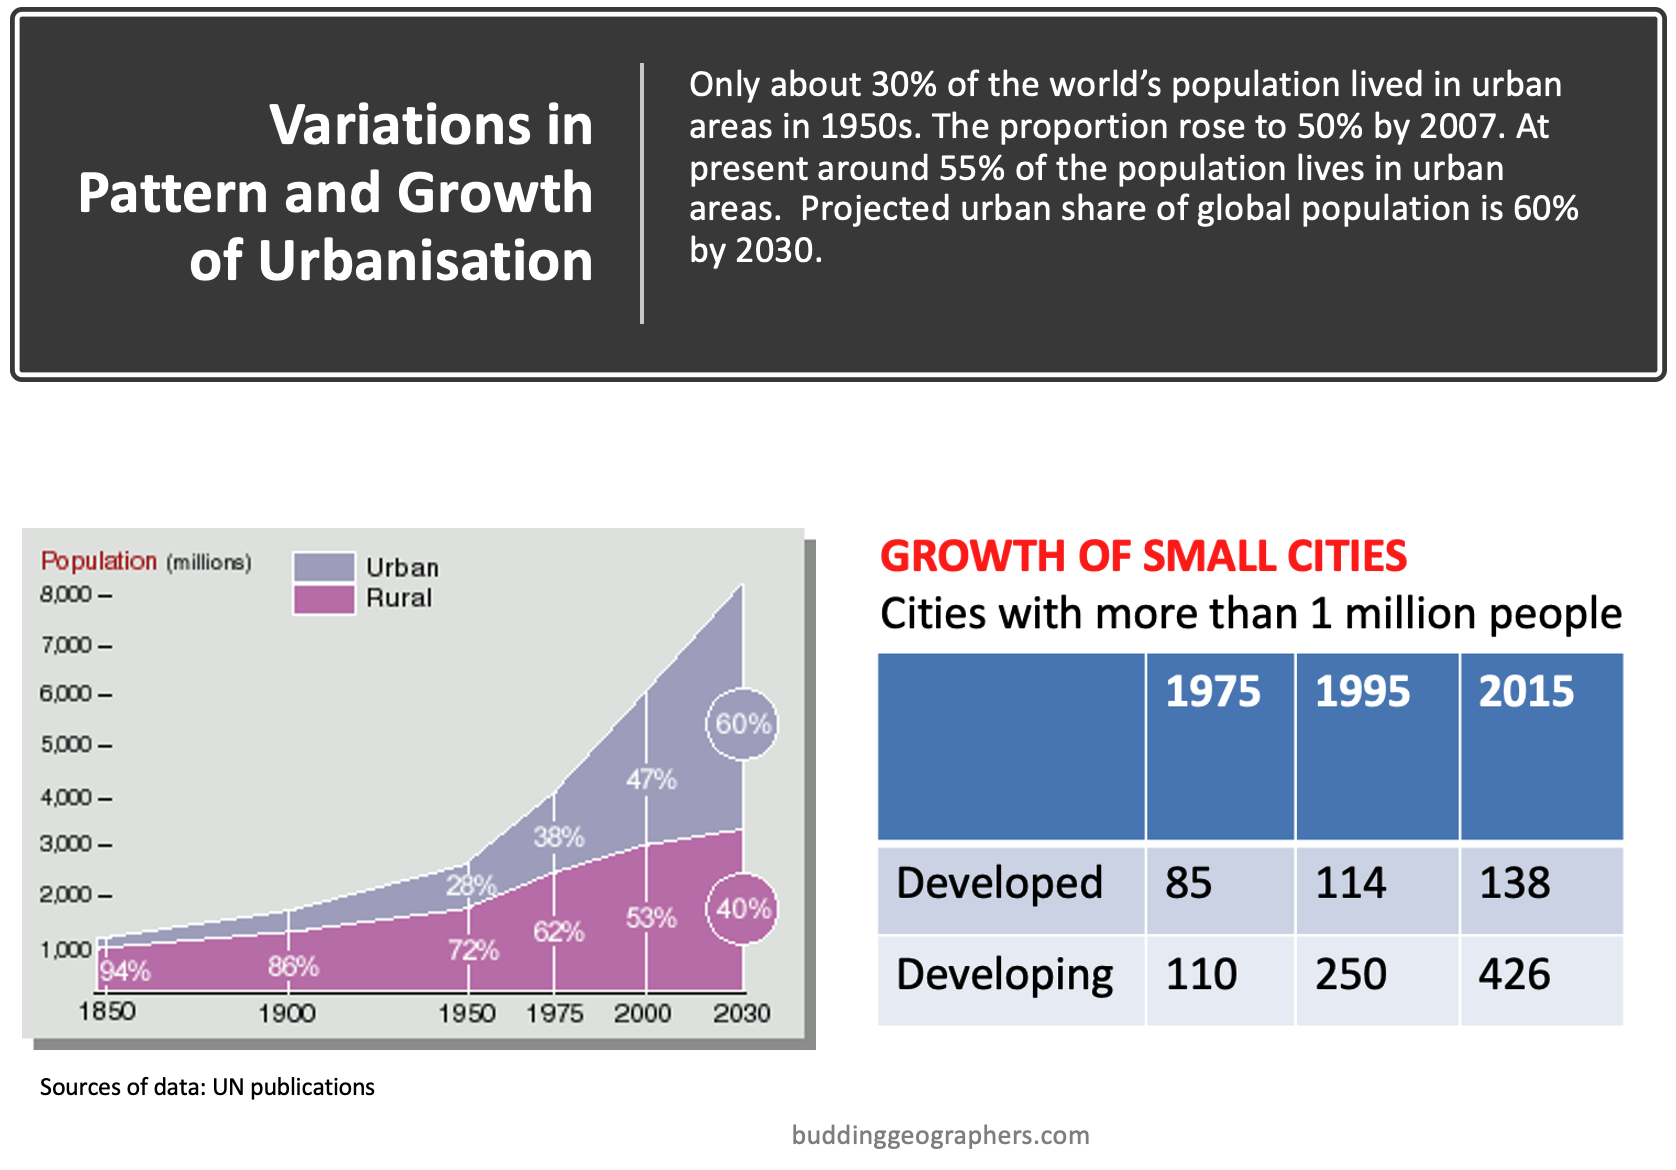
Only about 30% of the world’s population lived in urban areas in 1950
Today, 54 per cent of the world’s population lives in urban areas, a proportion that is expected to increase to 66 per cent by 2050.
refer: http://www.un.org/en/development/desa/news/population/world-urbanization-prospects-2014.html
Urban population grows as a result of
- Natural increase
- Net Migration: Internal rural-to-urban migration, International migration
Natural increase is the main cause of urban growth in LEDCs
About 60% of the urban population growth in developing countries is due to natural increase The remaining 40% is attributable to net rural-urban migration and reclassification of rural areas into urban sites. As fertility levels decline and economic development increases, migration assumes a greater role in determining the pace of urban growth.
In Africa, for example, natural increase accounts for 75% of urban growth, compared to 51% in Asia. In China, which has experienced rapid economic growth, only 28% of the urban growth results from natural increase (UN data).
According to UN report, between 2007 and 2030, the world’s population is expected to increase by 1.8 billion. Almost all population growth during this period will be in urban areas. The rural population will actually decrease by about 20 million.
Process will advance in developed nations, where 76% lived in urban areas in 2000, and will increase to 83% by 2030.Although the number of large cities is increasing, much of the urban population still lives in small cities
Urbanization trend in developing countries. Although developing countries are less urbanized, the rate of urbanization is much higher. The number of people added each year continues to rise because the rates are applied to an ever increasing population base. Despite their high levels of urbanization, the combined numbers of urban population in Europe, Latin America, Caribbean, North America (1.2 billion) is smaller than the number in Asia alone (1.4 billion). By 2030, Asia alone will account for 54% of the urban population of the world.
Throughout Southeast Asia and Sub-Saharan Africa, millions of people move back and forth between urban and rural areas to take advantage of income-earning opportunities—a phenomenon known as circular migration. Temporary migrants can cause large swings in population size. In some cities of China, for instance, temporary migrants are estimated to account for one-fifth to one-third of the total urban population

Centripetal and centrifugal movements within a city: Forces of urbanization
Cities are the products of many forces. They are engines of economic development, centers of cultural innovation, social transformation and political change. Cities vary in employment opportunities to pattern of land use and functions, ethnic composition and socio-cultural setup.
Urban Pull-Push Factor
| Pull Factor | Push factor |
|---|---|
| Potential for employment, high wages | Unemployment |
| Attraction of bright light- a typical type of cultural and social environment | Lack of safety |
| Better service provision- education and health | Lack of services, overcrowding, poverty |
| Greater wealth- scope of vertical movement along the social and economic ladder | High price of land and high cost living |
| Food food supply- lower risk of famine and drought | Development of commuter zone- express highway |
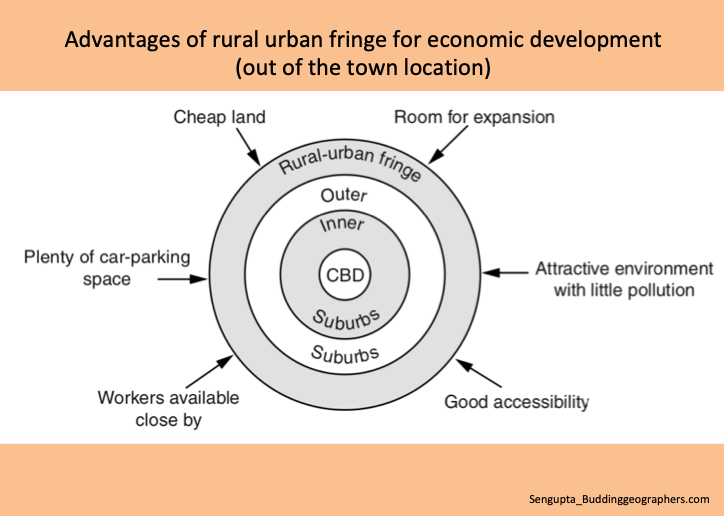
| Family and friends- community ties | Development of new subsidiary CBD at the rural urban fringe- Eg. Outskirt shopping mall |
Sub-urbanization vs Counter urbanization
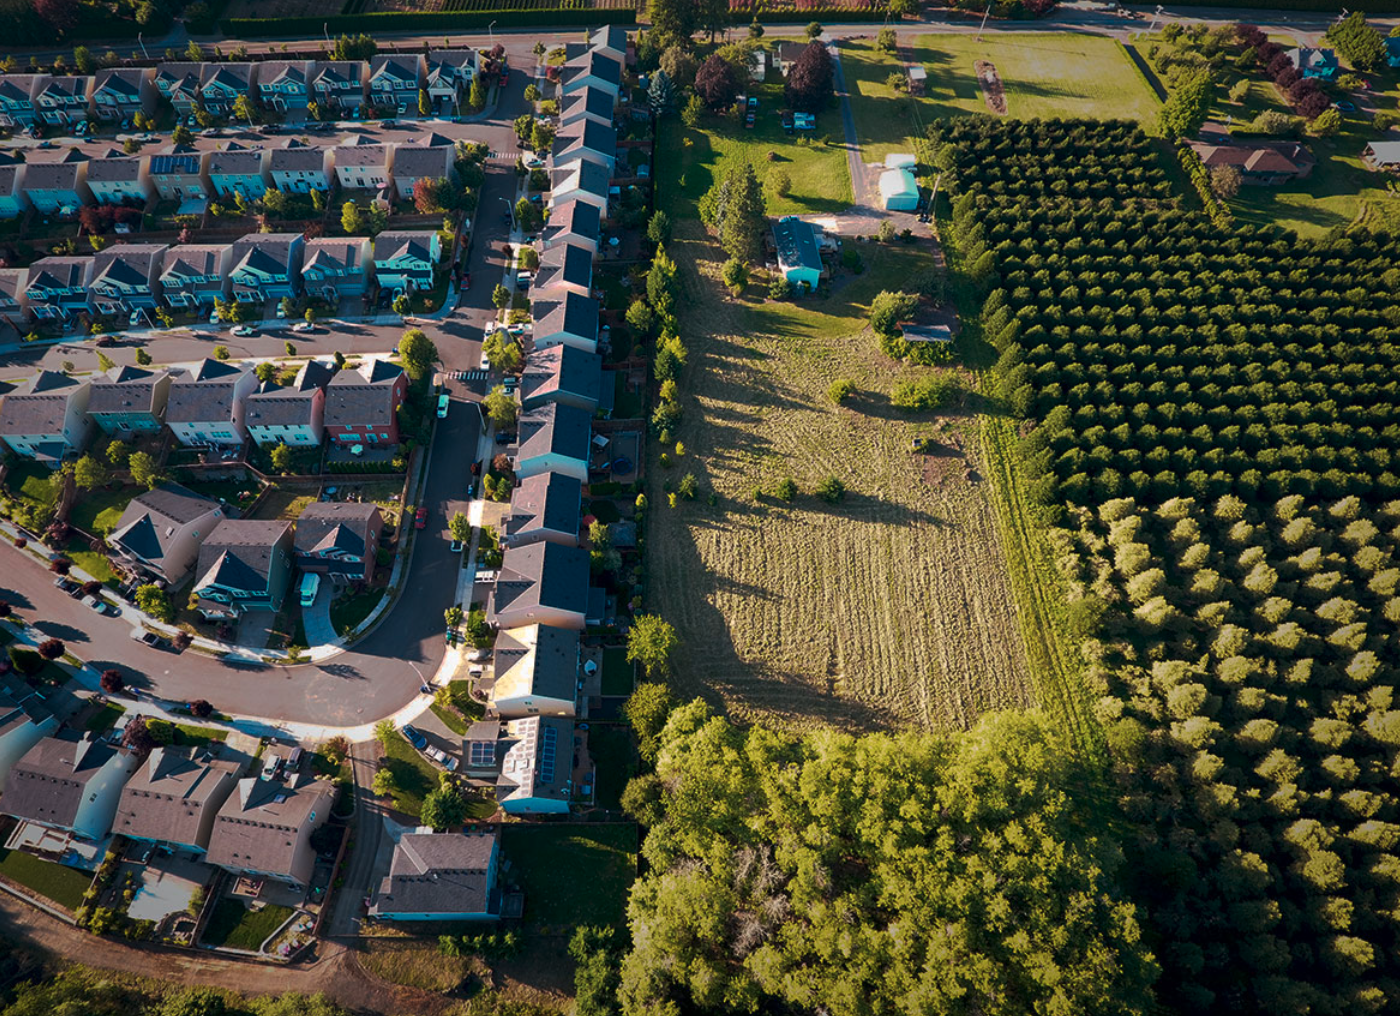
The outward expansion of towns and cities largely due to the improvements in transport system and out of the city expansion of affordable housing is called suburbanization.
The first UK Census, taken in 1801, recorded London’s population at just over 1 million people. The capital grew at a rate of around 20 per cent per decade reaching 6.5 million in 1901. The size of London’s population afterwards recorded a period of decline, initially resulting from the impact of the Second World War. By 1988 the population of London was 6.7 million, a decrease of around 22 per cent since 1939. Population in London again began to rise from the 1991 and in 2015; it reached 8.6million, the highest since its 1939 peak. According to the city authority, the boroughs with the largest percentage increase in numbers between 1939 and 2015 were all located in outer London, unsurprising given that overall the population of outer London increased by 24 per cent over this time.
Peripheral- suburban location could be a better choice for the following urban land-uses: Large assembling plants-car production, Floriculture, Industrial park, Out-of the town shopping malls like Blue water in Kent near London, airports, new modern and affordable residential uses.
Urban Sprawl: It is an uncontrolled growth of urban areas into previously rural areas. It is generally identified with outward suburban growth of a city. In common use, sprawl seems to have variety of meanings such as cheaply and quickly built neighborhood at the edge of a metropolitan area, lifestyles that centre around car trips, architecturally monotonous residential buildings with feeder roads and so on.
Counter urbanization: This process involves movement of people away from the larger cities to smaller town and villages due to high land prices, congestion, pollution, high crime rates, lack of community and declining services in the urban areas.

Prev
Next
Tasks:
Watch the video and make notes on the following aspects:
A. Elaborate any one factor that lead to the growth of suburbanization.
B. Pro and Cons of sub-urbanization
C. Define the term Suburbanization (2). Briefly outline two possible population/demographic changes in an urban area where suburbanization is occurring (2 +2) N15
Click here to see China’s rapidly growing cities. Note down the names of any 3 rapidly growing cities of China along with the characteristics of the urban places, site and major function.
Click here to have an idea about the rate of urbanization (people living in towns and cities). Identify 5 countries with very high (more than 80%) and the very low rate (below 40%) of urbanization?
I
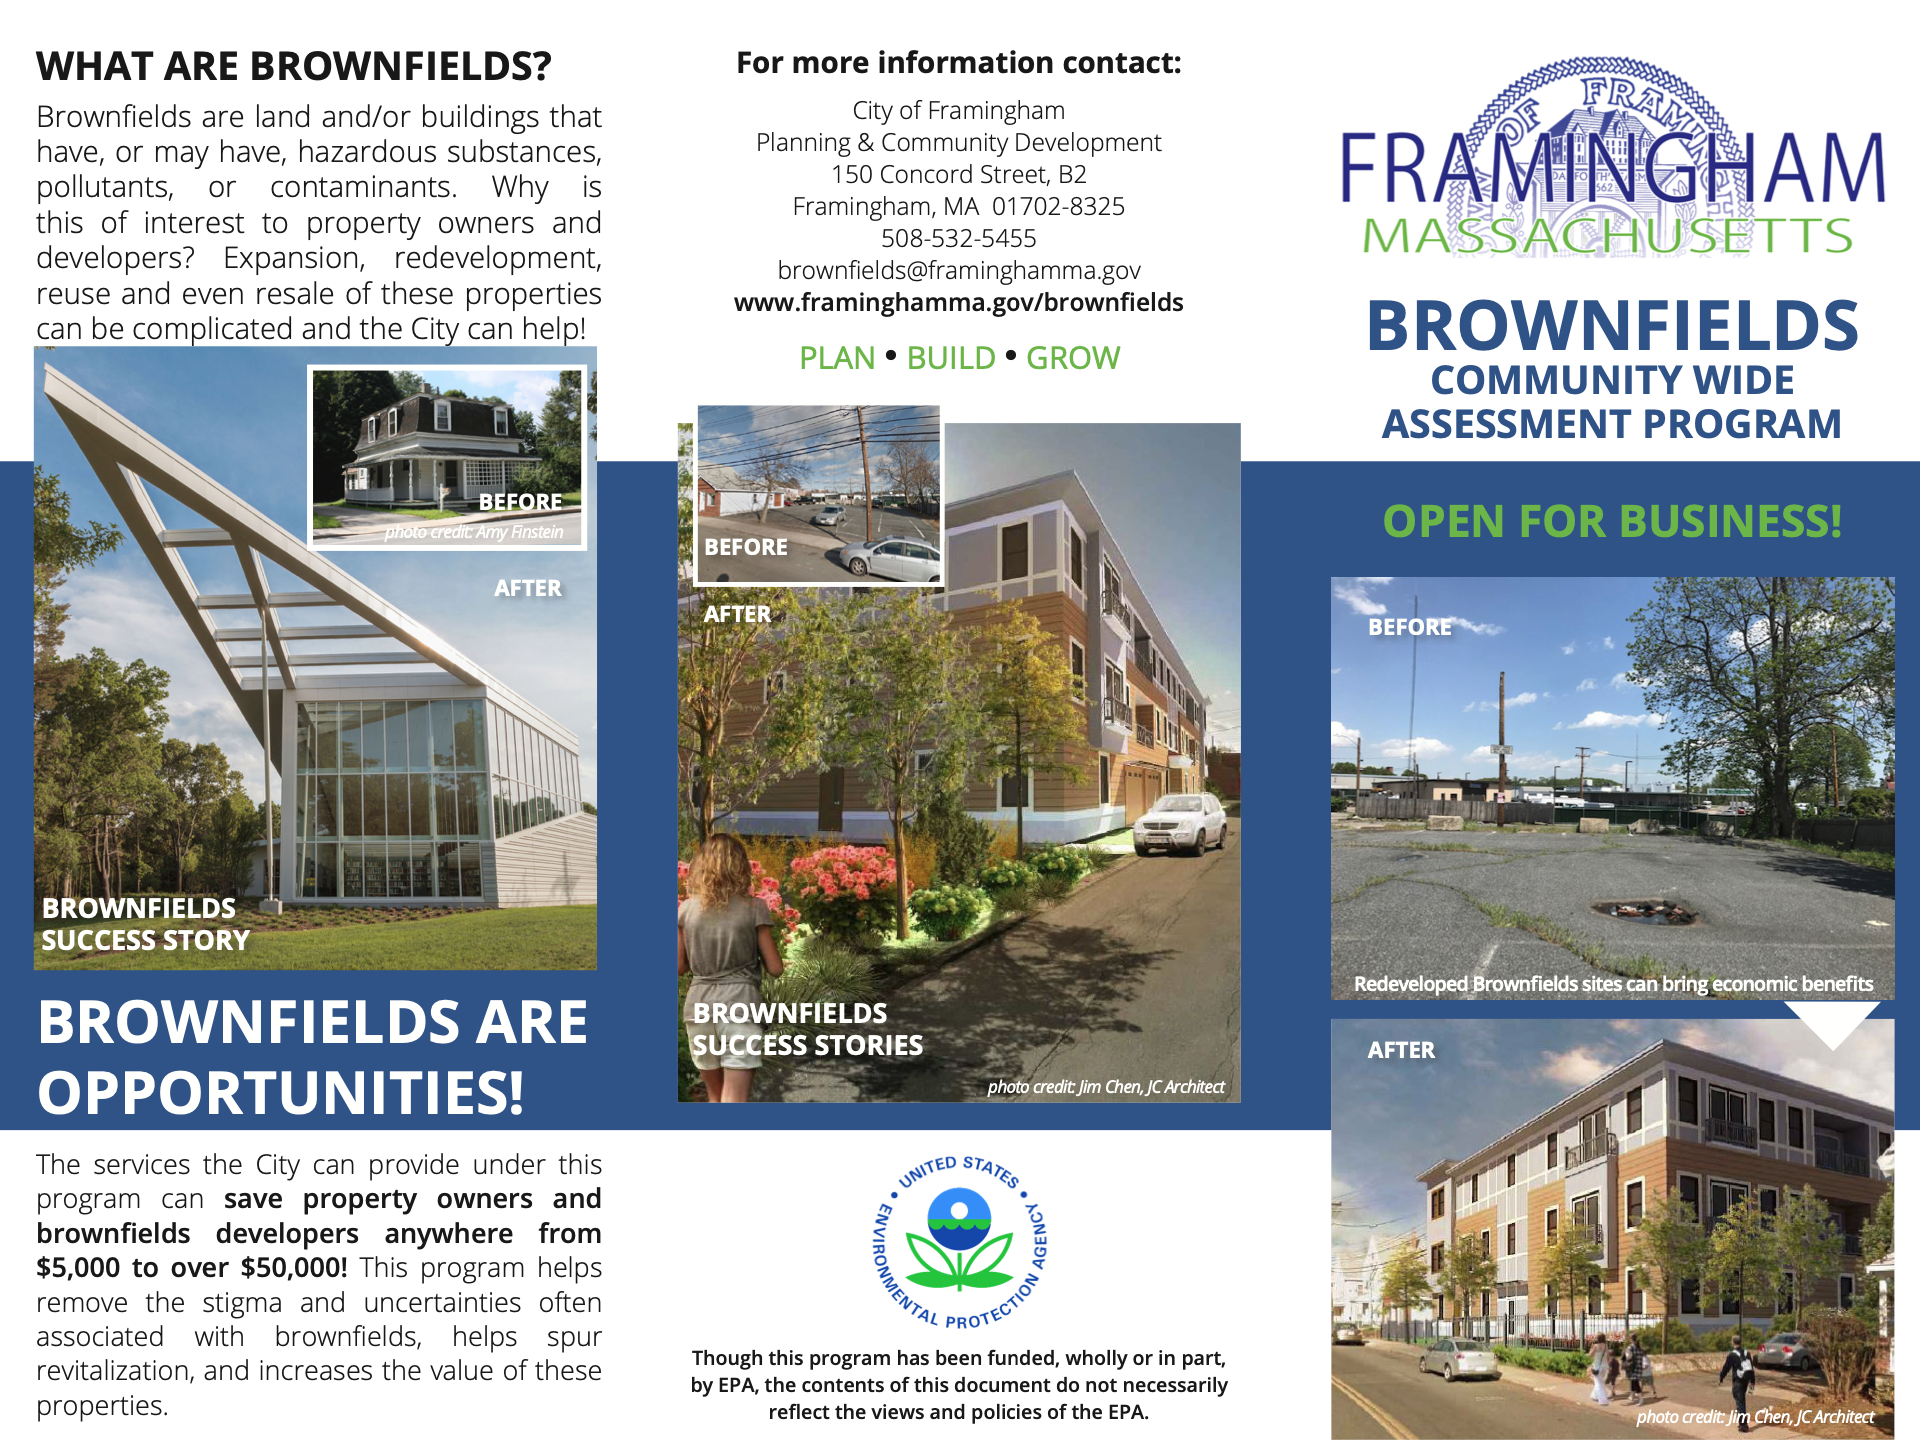
Brownfield site
Abandoned, derelict, unused sites or contaminated industrial buildings and industrial waste disposal sites that have potential for redevelopment are considered as brownfield sites.
Example of re-deveopment of Brownfield site
Massachusetts City of New Bedford (2014)- Brownfield Solar project
Vast abandoned plot of land that harbored hazardous waste affecting the environment and population in New Bedford, an economically depressed coastal city in southeastern Massachusetts is now a shining example of how renewable energy can transform the environment and local economies.
Your Task
Look at the following advertisement and analyze How does brownfield site recovery important to urban redevelopment?

Prev
Next
| Question | References | Additional references |
|---|---|---|
| How does brownfield site recovery help in urban redevelopment? | Read Article to analyze  |
Gentrification
Involves reinvestment of capital (money) in inner city areas marked by renovation and refurbishment old residential areas that lead to commercial redevelopment and residential rehabilitation of the old rundown areas. The term “gentrification” is attributed to the sociologist Ruth Glass who used it to describe the transformation that took place in London in the early 1960’s (refer). Gentrification has both pro and cons. Gentrification can be viewed both as a process of renewal or revitalization as it may attract capital investment as well as a process of displacement of the lower income group who used to be the residents of the area. This is known as urban filtering.
Examples
- New York- Greenwich village, Manhattan
- London- Fulham, Dockland
Major Problem of gentrification
Urban Filtering– may lead to displacement of poor people as the land value rises and young upwardly mobile people take their place.
Your Tasks
Prev
Next
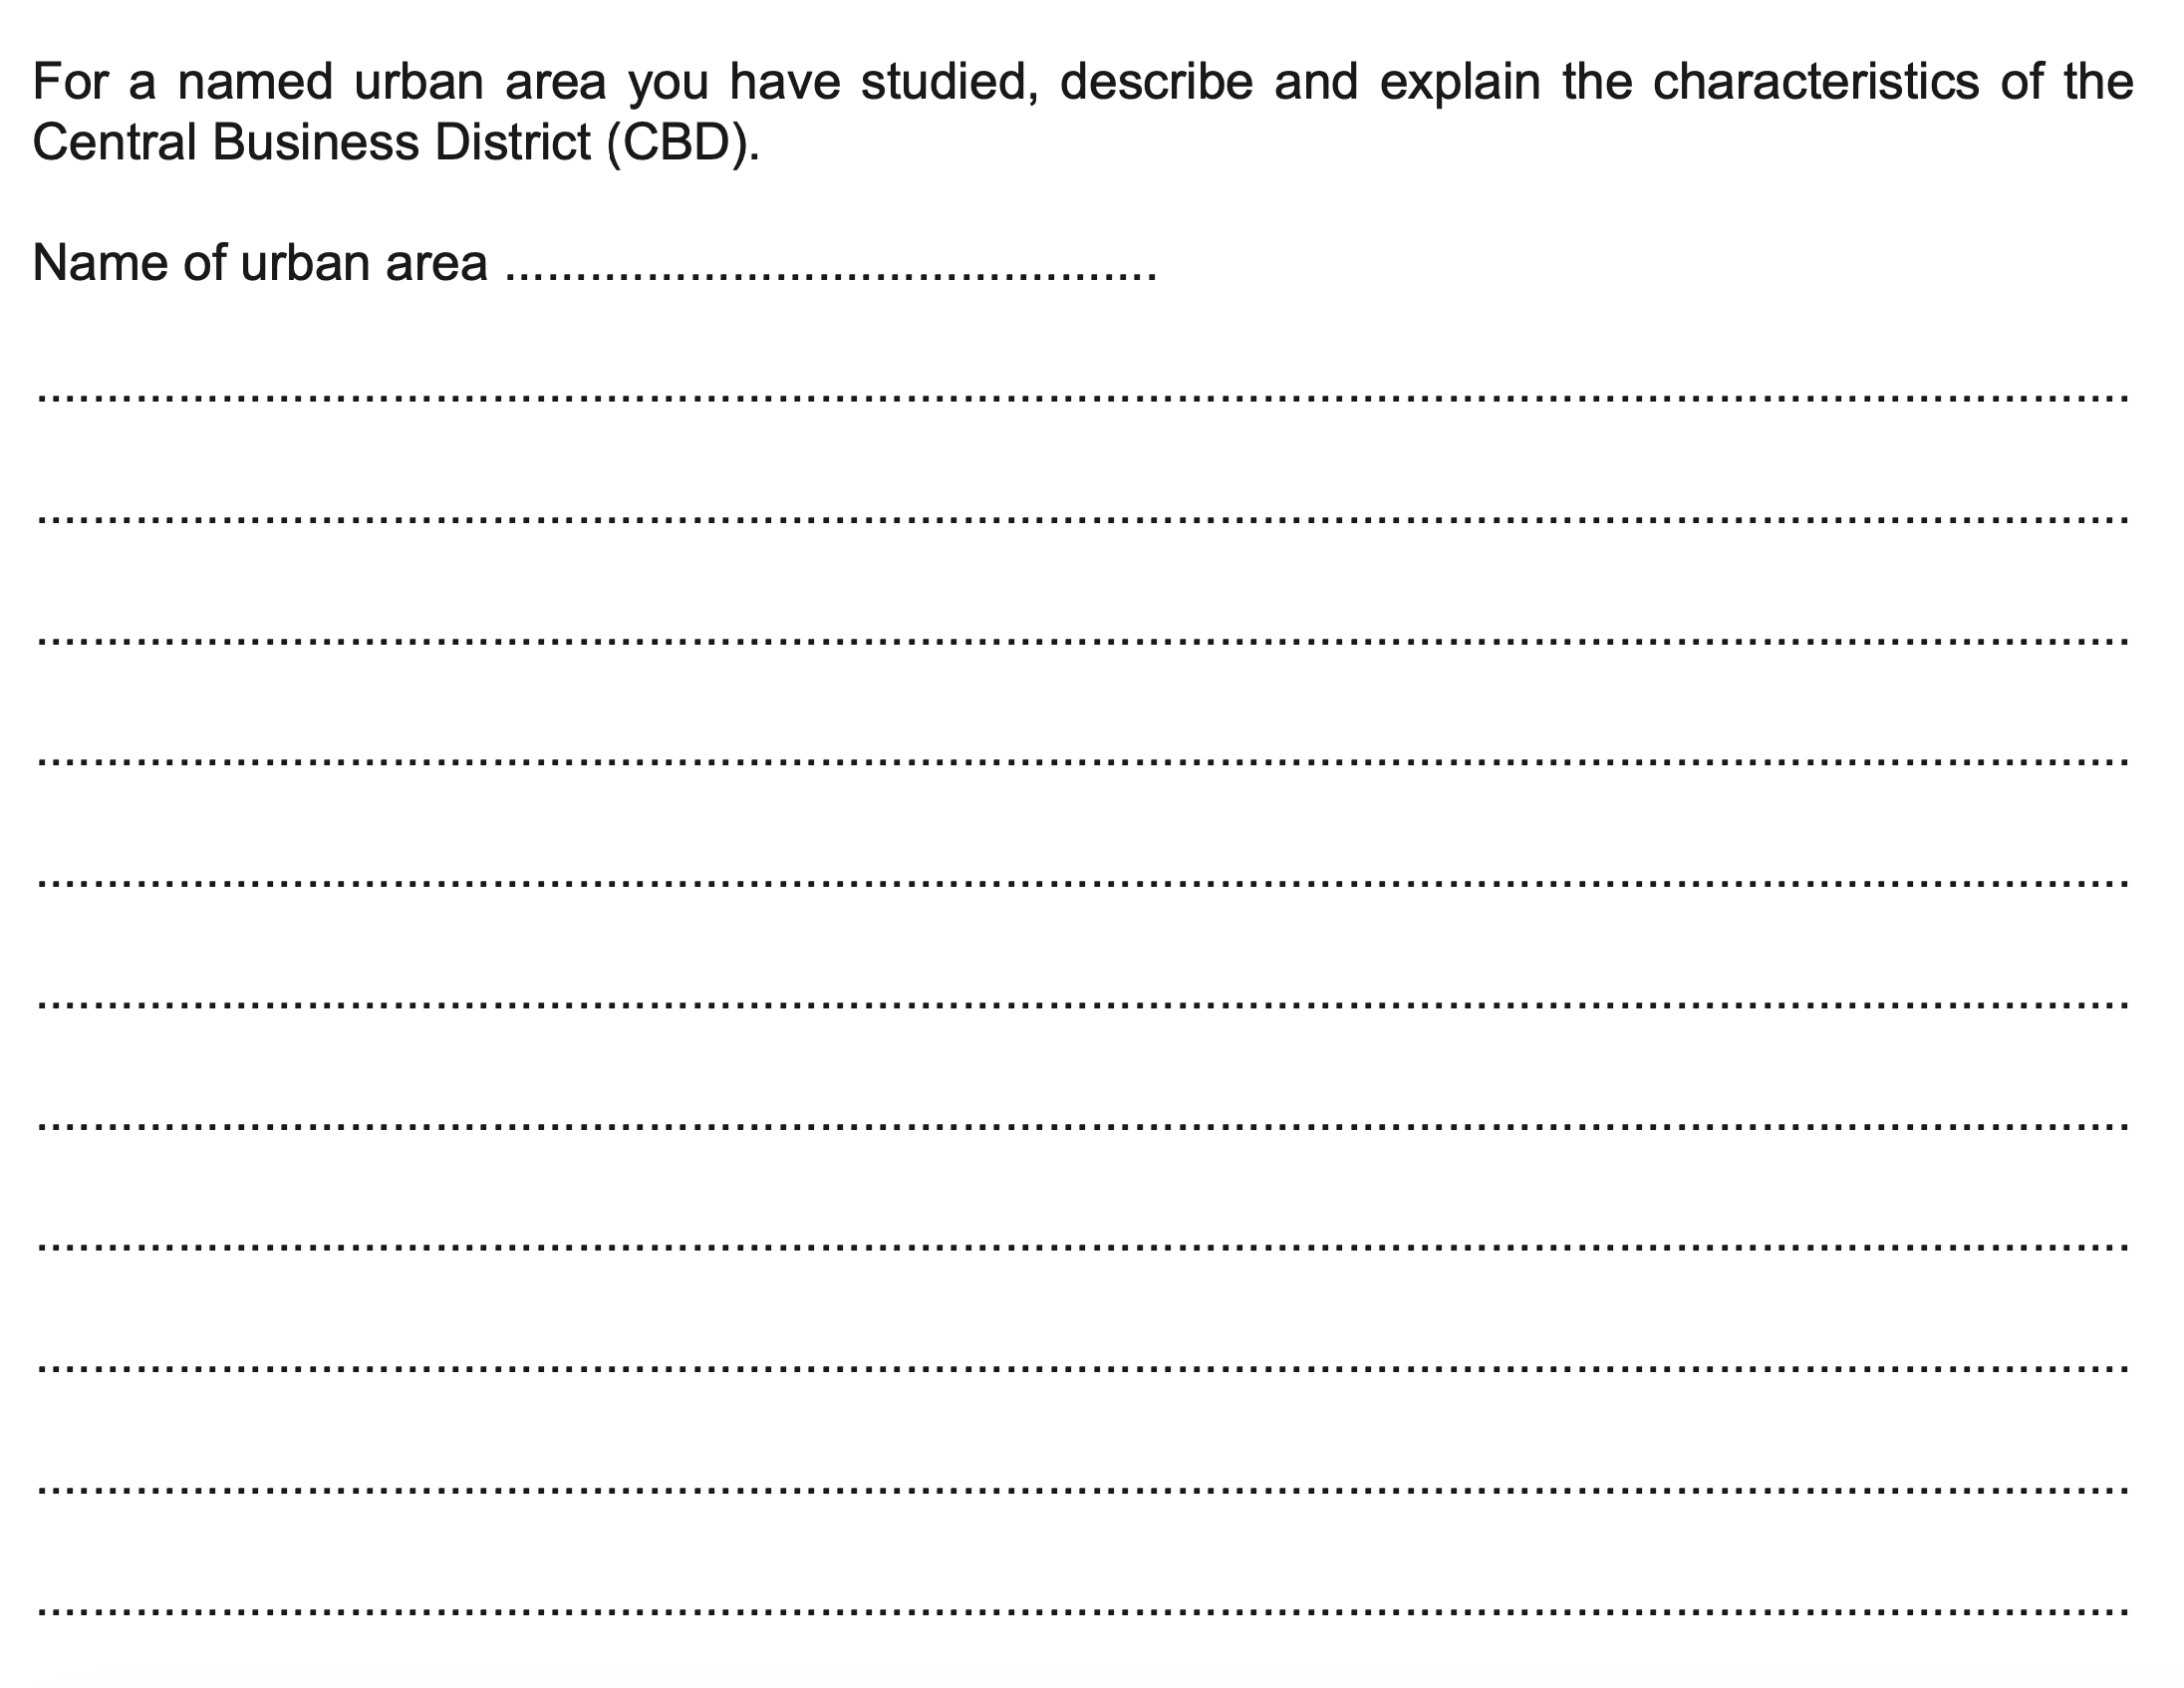
What does it mean by CBD?
What are the common land-uses (characteristics) of a CBD?
Use Lucidchart (sign up for free) to create intelligent diagram that shows the features of a CBD.
What does it mean by inner city?
What are the probable impacts of gentrification in inner-city areas?
Note: The historical background of gentrification in USA (in the city of Chicago), faulty urban management and policy of gentrification creating racial divide.
Note: The process of social filtering
Note down the adverse social impacts of gentrification
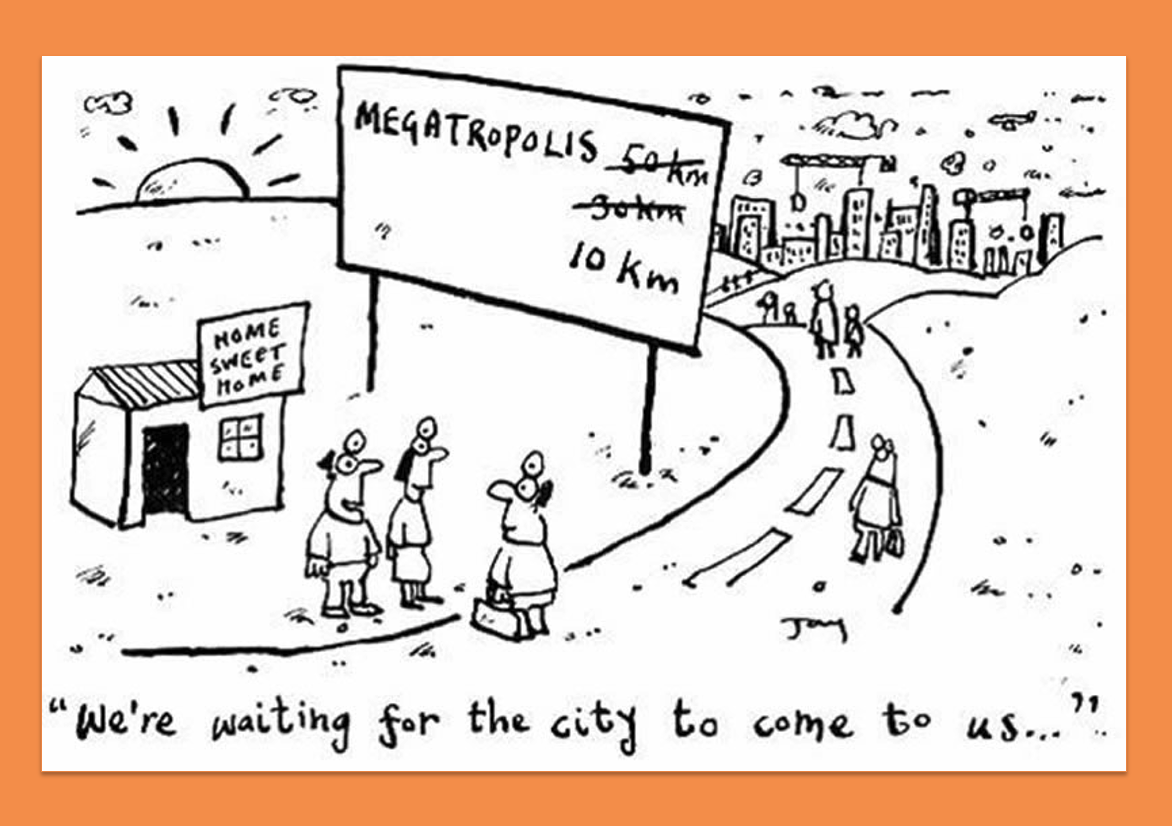
Urban Sprawl and Informal Economy
Unban sprawl denotes the physical expansion of city area outside the planned built up area as a consequence of unplanned urban growth.
- Pollution is a major cost of urban sprawl. Most sprawling towns are built for cars and force people to drive more frequently and for longer periods of time. Increased use of cars leads to more air and noise pollution as well traffic congestion. Sprawl can damage natural ecosystem through destruction of natural habitats and wetland. Loss of farmland and fringe forest increase the risk of flood. Cities are bound to grow, but they need planning to cope up with the problem of urban sprawl.
Prev
Next
What does this cartoon intend to show? Try to draw a cartoon pointing out the problems of urban sprawling using your iPad.
Prev
Next
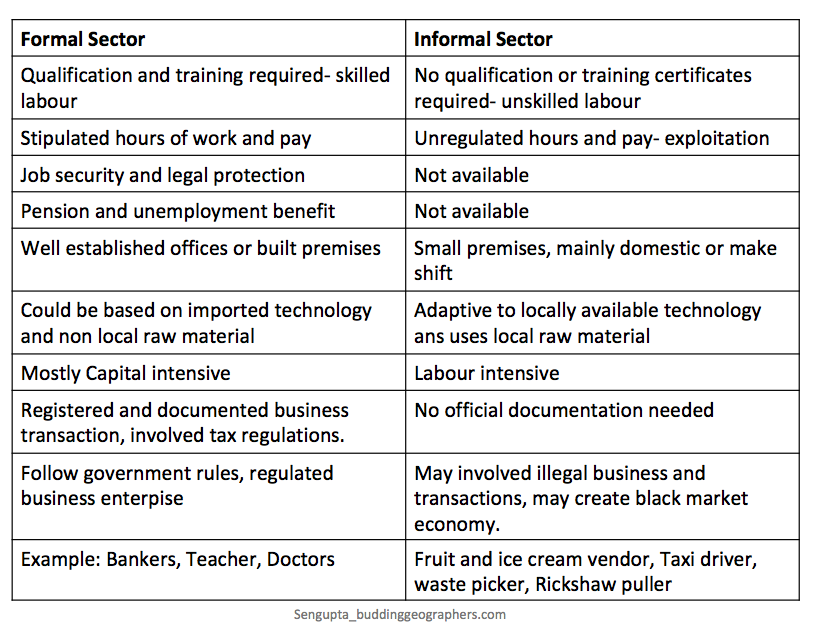
Recap from IGCSE
| Primary Sector | Extraction of raw materials from the nature e.g. agriculture, fishing, farming, forestry and mining etc. |
| Secondary Sector | Transforming raw materials into semi-finished goods or finished goods. This sector includes metal working and smelting, automobile production, textile production, chemical and engineering industries, aerospace manufacturing, energy utilities, engineering, breweries and bottlers, construction, and shipbuilding. |
| Tertiary Sector | Provision of services to businesses and consumers. Activities associated with this sector include retail and wholesale sales, transportation and distribution, entertainment (movies, television, radio, music, theatre, etc.), restaurants, clerical services, media, tourism, insurance, banking, healthcare, and law. In most developed and developing countries, a growing proportion of workers are devoted to the tertiary sector. In the U.S., more than 80% of the labor force is tertiary worker. |
| Quaternary Sector | Research and development, This sector is said to be that of intellectual organization in a society such as research organization, cultural programs, information technology (IT), higher education, and libraries. |
| Quinary Sector | Highest levels of decision making in a society or economy. Top executives (CEOs) or officials in senior management in different organization as in government (Ministers, diplomats), Universities (Head of the organization) etc. |
Urban Land use
Location of Residential areas: Residential choices are determined by several factors
- The ability to pay for housing
- The age of the population and family circumstances, stages in family life cycle (wealth, age and family status)
- History (age, quality of buildings, modern energy efficient and cost saving building structures in the suburbs)
- Topographical characteristics (geology, drainage, and relief may mean that higher class buildings are built in less hazardous locations). For example the slums of Dharavi in Mumbai particularly become vulnerable to floods during the wet season as the Mithi river overflows in every rainy season.
- Religious and ethnic influences for example China town or ethnic villages in a city.
- Government policy and redevelopment efforts eg. construction of the Tianjin eco-city in China.
- Proximity to services, such as schools, hospitals, shops, accessibility and transport links, job location.
- Proximity to congested roads; inner-city slums, derelict land, waste sites and sewages can have negative effect on house prices.
- Perception of better surroundings for example, leafy spacious suburbs.
- Urban processes like: Suburbanization, gentrification, sprawl, counter urbanization etc.
Residential segregation: is the physical separation of population on the basis of culture, ethnicity, income and other criteria. Common examples of residential segregation are the existence of ghettos and China town in certain specific parts of the large cities.
Enormous skyscraper set to dominate New York skyline. Click here to see high rise residential complex at the heart of the New York City. Also view world’s most expensive urban real estate market
Murdie’s composite ecological model of urban residential structure
To understand the aspects of cities residential structure Murdie (1969) identified two main dimensions of urban space.
1. Physical space -physical characteristics of land like presence or absence of river or coastlines, slope of the land, micro climate etc.
2. Social space– is differentiated into three aspects like economic status, cultural or ethnic status and family status.
- Social spaces have been superimposed on physical space to explain the distribution of urban residential structure.
- The model explains that cities are complex entities.
- People’s choice of home is usually constrained by their income. At each stage in family life-cycle, people have different housing needs.
- For example, a young person may seek a rented flat in the inner ring of the city while in the later stage of life the same person may relocate to a garden house in the suburbs.
- Thus different parts of the city may reflect different stage of family life cycle.
- On the other hand, specific ethnic minorities tend to cluster in specific parts of the city, creating a pattern which is neither sectoral nor concentric.
Growth of urban transport infrastructure over time
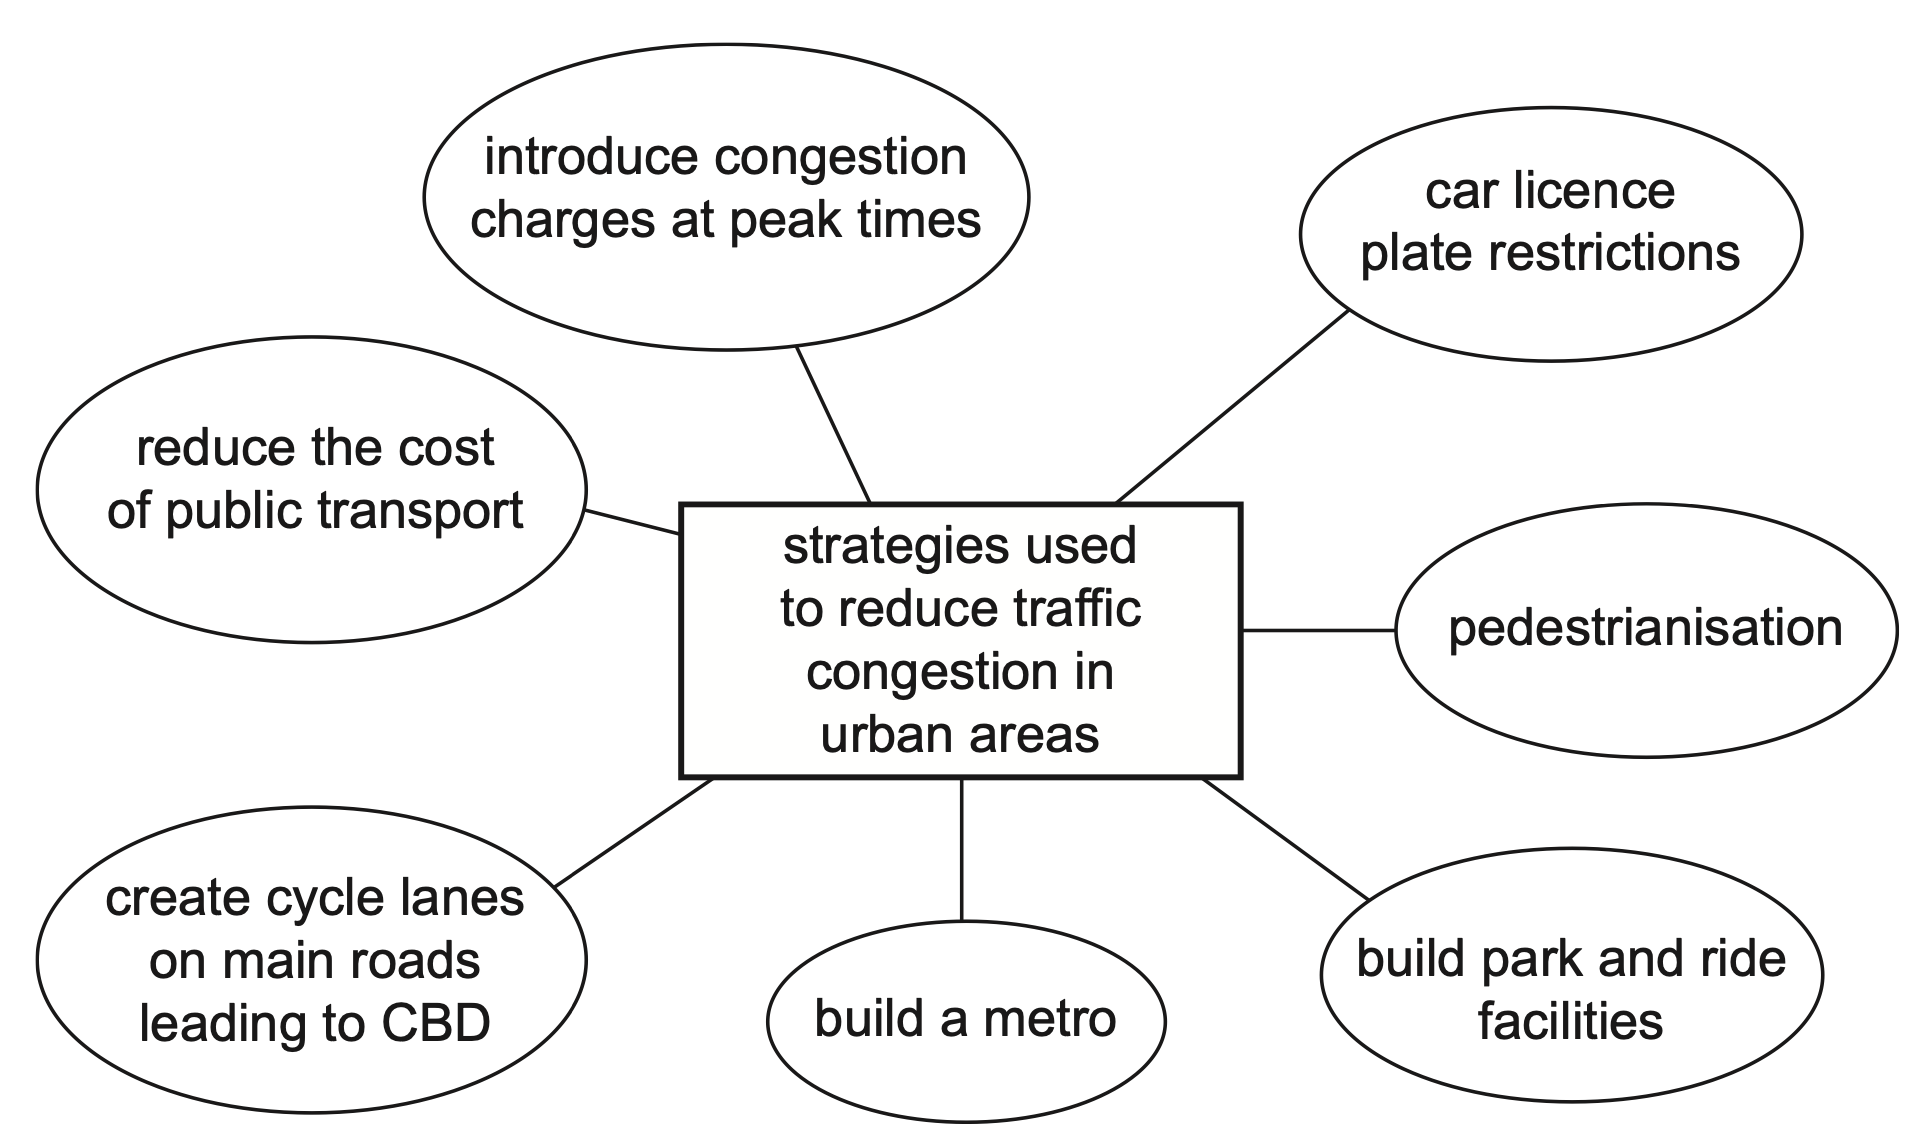
Managing traffic problems in cities
Find out some suitable photos that depict significant aspects of urbanism or urban morphology. Insert your selected photographs using this link. Add explanations on your selected features of urban landscape.
Prev
Next

Prev
Next
What is meant by a Sustainable city?
Sustainable urban development aims to meet the needs of the present generation without compromising the needs of the future generations.
How to achieve sustainability?
- Ensure environmental quality- preservation of urban areas and green field- less pollution, more recycling (example of Hamburg)
- Greater access to employment and adequate livelihood
- Safe, secure and affordable housing
- Better provision of water, sanitation, better and efficient transport, healthcare, education (example of Curitiba)
- Use of renewable resources and systems like rain water harvesting, solar energy etc (example of Tianjin Eco city)
- Introduction of new sustainable concept such as urban agriculture (roof top farming in Hamburg and Singapore )
- Stress minimization and creation of urban community- the sense of belonging together and sharing the same resources (For example the city of Copenhagen
- Reduction of urban ecological footprint by following circular metabolism system to minimize new inputs and maximize recycling(refer Roger‘s model)
Ecological footprint is the theoretical measurement of the total area of ecologically productive land and water (cropland, pasture, forest, marsh, river, sea, etc.) that a population requires in order to produce the resources (the energy and materials consumed) it consumes and to absorb its wastes, under prevailing technology.
Read Article: why Curitiba in Brazil is a sustainable city
Prev
Next
Solid Waste Management in urban areas
Solid waste management deals with generation, prevention, characterization, monitoring, treatment, handling, reuse and residual disposition of solid wastes.
Solid waste management is a challenge for the city authorities particularly in the developing countries mainly due to the increasing generation of waste. This huge quantity of Solid wastes imposes stress on the municipal budget as a result of the high costs associated to its management. Increasing population levels, booming economy, rapid urbanization and the rise in community living standards have greatly accelerated the municipal solid waste generation rate in developing countries (Minghua et al., 2009). It has been reported that collection, transfer and transport practices are affected by improper bin collection systems, poor route planning, lack of information about collection schedule, insufficient infrastructure, poor roads and number of vehicles for waste collection and to the pricing for disposal.
Statistics:
According to the World Bank report, 2015 (What a waste: A global review of solid waste management) the amount of municipal solid waste (MSW), one of the most important by-products of an urban lifestyle, is growing even faster than the rate of urbanization. Ten years ago there were 2.9 billion urban residents who generated about 0.64 kg of MSW per person per day (0.68 billion tonnes per year). This report estimates that today these amounts have increased to about 3 billion residents generating 1.2 kg per person per day (1.3 billion tonnes per year). By 2025 this will likely increase to 4.3 billion urban residents generating about 1.42 kg/capita/day of municipal solid waste (2.2 billion tonnes per year).